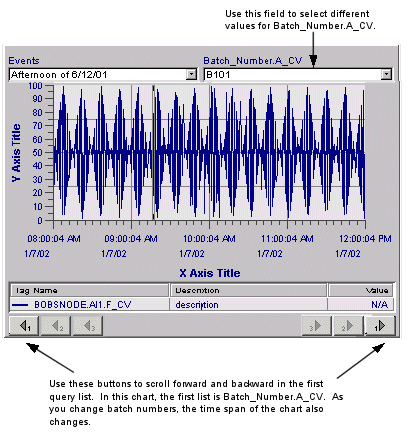
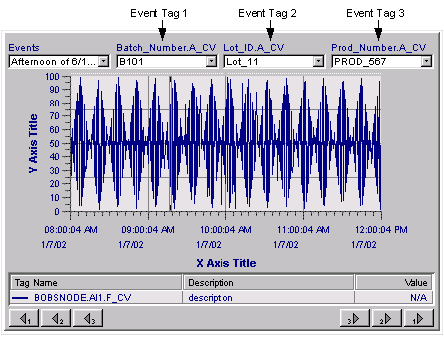
The events and queries defined in an event chart determine the number of fields and buttons available on the chart at run time.
|
Example If you create an event with only one query, the chart displays only fields and buttons for that event and query, as the following figure shows. The scroll buttons at the bottom are enabled according to the number of queries you have entered. |

|
|
Adding more queries adds more fields to the chart and the additional scroll buttons are enabled. The following figure shows an event chart with all three queries defined. |

|
NOTE: To make sure you are seeing the most up-to-date values in the values combo box(es), select the event from the Events drop-down list. This will update the values for an event query that is set with Relative or Range time criteria.
Similar to pen groups, event groups can be loaded and saved during run-time. You can load/save event groups from the chart's configuration panel, or from the context menu. The following procedures describe the context menu method. For information on the configuration panel method, refer to To load an event group from the configuration panel.
NOTE: To save event groups, you must be granted the `Save Event Groups' permission (if security is enabled). See your system administrator for more information.
To load an event group in run-time
Right-click the Event chart and select Load Event Group from the context menu. The Open Event Group dialog box appears.
Navigate to the location of the event group and select it.
Click OK. The event is loaded into the chart and is available for selection from the Events list box.
To save an event group in run-time
Right-click the Event chart and select Save Event Group from the context menu. The Save Event Group dialog box appears.
Navigate to the location you want the event group to be saved to.
Enter a name for the event group.
Click Save.