Charts Properties | Configuring an Event chart | Event Groups | Linking Event Charts to other Objects
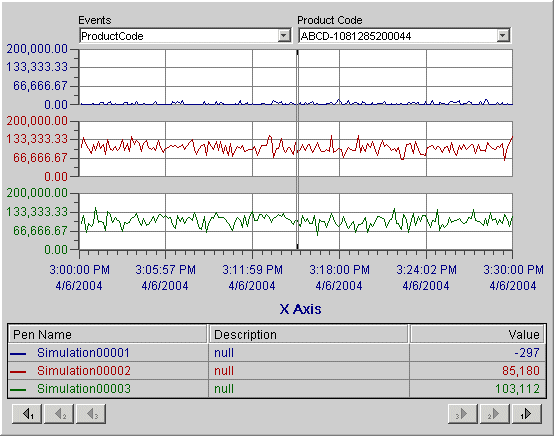
Time charts are useful to display line graphs when you know the time interval you want to examine. However, you may not know the exact time of the data you want to show; you may only know the lot ID or product number. By specifying this information in an Event chart, you can plot a trend without knowing the time span.
The Event chart is supported for use with Proficy Historian data sources only.
When using an event chart, you create one or more events and up to three event queries. An event defines a time span. By default, when you create an event, the chart assigns an initial time span for you so that you can begin creating event queries. The initial time determines the initial set of data retrieved from the server. The data retrieved, in turn, determines the initial values available for the first event query.
The following example Event chart compares three historical event trends. For more information on using event trending, see Trending Event-based Data.