PlotOpen
Opens a new plot, sets its output device, and returns its plot handle. You can send the plot to any one of your system printers, or display it on screen at the specified AN.
you need to call this function before you can call the other plot functions.
Syntax
PlotOpen(AN, sOutput, Mode)
AN:
The animation point (AN) where the plot will display. Set the AN to 0 (zero) when sOutput is a printer.
Do not use an animation point number at which a graphic object exists as this will prevent the PlotOpen() function from succeeding.
sOutput:
The output device where the plot is sent, for example:
Mode:
When a plot is removed or updated, the portion of the background screen beneath it is blanked out. The mode determines how the background screen is restored. The mode of the plot system:
1 - Normal mode
2 - Use for compatibility with the old graph functions
17 - Soft (valid for normal mode). The background screen (a rectangular region beneath the plot) is restored with the original image. Any objects that are within the rectangular region are destroyed when the background is restored.
33 - Hard (valid for normal mode). The background screen (a rectangular region beneath the plot) is painted with the color at the AN.
65 - Persistent (valid for normal mode). The plot is not erased. As the plot is updated, it is re-displayed on top. This mode provides fast updates. Transparent color is supported in this mode.
129 - Opaque animation (valid for normal mode). The plot is not erased. As the plot is updated, it is re-displayed on top. This mode provides the fastest updates. Transparent color is not supported in this mode.
257 - Overlapped animation (valid for normal mode). The background screen (the rectangular region beneath the plot) is completely repainted.
Return Value
The plot handle if the plot is opened successfully, otherwise -1 is returned. The plot handle identifies the table where all data on the associated plot is stored.
Related Functions
PlotClose, PlotDraw, PlotGrid, PlotInfo, PlotLine, PlotMarker, PlotScaleMarker, PlotText, PlotXYLine, TrnPlot
Example
hPlot=PlotOpen(0,"LPT2:",1);

IF hPlot <> -1 THEN

	/* Set up a black frame with red & blue grid lines. */
	PlotGrid(hPlot,18,450,800,1850,1600,5,red,10,blue,4,black,white,0);

	/* Draw a scale line to the left of the frame. */

	PlotScaleMarker(hPlot,400,1600,6,1,black,0);

	/* Plot a simple line in green for a table of 10 values. */

	PlotLine(hPlot,0,green,3,6,green,2,10,Buf1,0,100,1);

	/* Plot a line in yellow (with black markers) for tables of 8 X and Y values. */
	PlotXYLine(hPlot,0,yellow,4,3,black,2,8,Buf2,0,150,Buf3,0,100,1);

	/* Draw a title box above the plot frame, with the heading "Citect Graph". */

	PlotDraw(hPlot,1,0,black,1,grey,900,250,1400,400);

	hFont = DspFont("Times",-60,black,grey);

	PlotText(hPlot,hFont,0,950,350,"Citect Graph");

	PlotClose(hPlot);

END
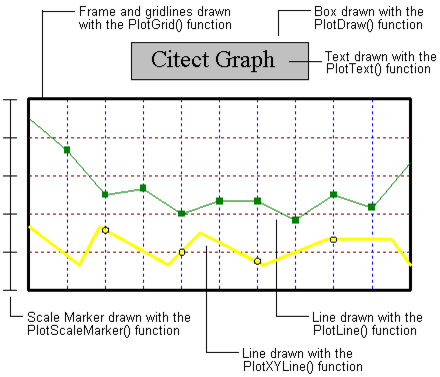
The above example prints the following (on the printer):
PlotOpen(0,"LPT1:",1)	// opens a new plot to be sent to printer

PlotOpen(20,"DISPLAY",17)	// normal plot with soft animation

PlotOpen(20,"DISPLAY",257)	// normal plot with overlap animation

PlotOpen(20,"DISPLAY",1)	// normal plot with overlap animation
(for default animation mode is overlap animation)

PlotOpen(20,"DISPLAY",16)	// INVALID
(does not specify whether it is normal or Version 2.xx mode).

PlotOpen(20,"DISPLAY",2)	// INVALID for Version 2.xx graph system
(does not support display as output).
See Also