Curve parameters |
|
Manual -> Extended Trend Module (ETM) -> Engineering in the Editor -> Curve parameters |
Curve parameters |
|
Manual -> Extended Trend Module (ETM) -> Engineering in the Editor -> Curve parameters |
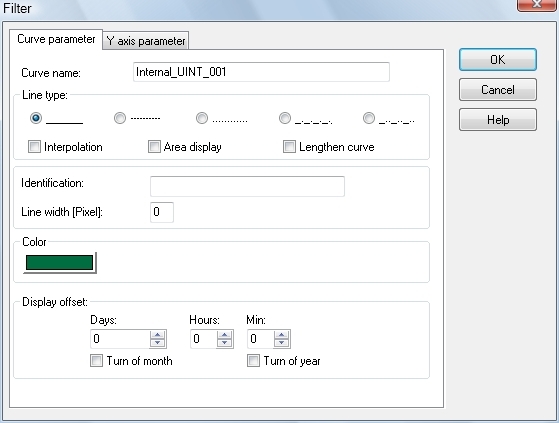
If in the dialog 'Create Dialog' (see chapter Create a new diagram) the button
'Edit curve' is pressed,
the filter dialog opens. In this dialog and in the
dialog Y axis parameters the curve
parameters are defined.

For each trend curve the curve features can be parameterised.
|
|
System functions |
|
Curve name |
Freely definable curve name |
|
&Type of line: |
Definition of line type for trend curve: |
|
|
Rectangle |
|
|
- Dashes |
|
|
- Dots |
|
|
- Dash-dot |
|
|
- Dash-dot-dot |
|
Interpolation |
Values connected by poly-lines (supporting positions). If the option is not set then the value changes are shown as line jumps (stepped representation) |
|
Area display |
The values are displayed as areas instead of lines. |
|
Lengthen curve |
The curve is lengthened from the last available datapoint to the right border |
|
Axis labelling |
Text of the axis labelling in online representation |
|
Linewidth |
Width of the line (in pixels) |
|
Color |
Definition of the trend curve colour for the online representation |
|
Y-axis |
Definition of the parameters of the Y-axis for each trend curve. (Scaling, axis subdivision, value range, colour etc.) |