This section assumes:
·You have already created the BLOCKS and TAGS you plan to add to your Data Log Trend Group Displays. You can type in the Tag Names and Block Names of tags and blocks you plan to build.
·You have to enabled DATA LOGGING for each TAG using Log Data in Tag Properties (see Analog Tag Properties or Discrete Tag Properties).
·This section assumes you have started Internet Explorer Web Browser and connected to your Project Node.
1. Start WebAccess Configuration.
2. Login with User Name and Password.
3. Select your Project Name.
4. The SCADA Node. The SCADA Node Main Page opens.
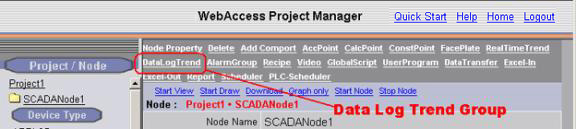
Figure 6-3 Data Log Trend Group - Project Manager
5. Select DataLog Trend.
The Data Log Trend Display Group List Page appears.
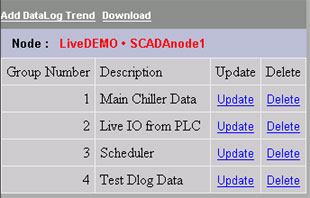
Figure 6-4Add Data Log Trend Display group
6. Select Add DataLog.
7. The Create New DataLog Group appears.
Figure 6-5 Create Data Log Trend Display
Group
8. Enter a Unique Group Number (between 1 and 1000). This is how the Group will be ordered in the Data Log Trend Group Dialog Box in VIEW and identified by Operators and Users.
9. Enter a Description for the group. This will appear in the Data Log Trend Group List Dialog Box seen by users and operators in VIEW. 32 characters is the maximum length.
10. Optionally, select a different Trend Template; dlogtrd.bxx is the default. Users can create use multiple trend templates (e.g. different colors and layouts) in the same project. For example some trend groups can have black backgrounds to facilitate viewing while others have white to facilitate printing on paper. Users can create and assign up to 100 extra customized trend graph templates for Realtime/Datalog Trend groups. For more information, see 6.2.2 Data Log Trend Display.
11. Select the pull-down list next to Time Span. The default value is 6 minutes. This will determine the default time span and sample interval when this display first opens (the user can modify this on the fly).
DataLog Trend supports the following time spans for viewing data: 6 min, 12 min, 30 min, 1 hour, 2 hour, 4 hour, 6 hour, 12 hour, 18 hour, 24 hour, 2 day, 4 day, 1 week, 1/2 month, 1 month, 2 months, 3 months, 4 months, 6 months, 1 year, 2 years, 3 years, 4 years, and 5 years. This feature allows the viewing of data at a sample frequency different than the recording frequency. The intent is to allow users to adjust the time span across the screen. This does not affect the actual data recording rate. See (4.2.15 Log Data, 4.2.16 Data Log DB, and 3.2.23.1 Disable Data Log Seconds recording).
6 min is 1
second sample interval.
12 min is 2 second samples
30 min is 5 second samples
1 hour is 10 second samples
4 hour is 40 second samples
6 hour is 1 minute samples
12 hour is 2 minute samples
1 day is 4 minute samples
2 day is 8 minute samples
1 week is 28 minute samples
15 days is 1 hour samples
1 month is 2 hour samples
3 months is 6 hour samples
1 Year is daily samples
12. Select the field next to Tag Name 1.
13. Open the Pull down list by clicking on Tag List (Figure 6-5). This shows the names of all Analog Tags with Log Data and Discrete Tags with Log Data set to yes.
14. Scroll down the Tag List. Click the Tagname desired. The Tagname should appear on the Tag Name 1 field.
15. Repeat for Tag Name 2 to 12.
16. If you did not enabled Data Log for a tag, you can enable data Log later and enter the tag name now. You can Type Tag names and Blocks (BLOCK:PARAMETERs). You can also copy and paste Tag Names and Block Names from the Left Frame of your browser.
17. Select the opening Plot Type that will appear for each tag.
Users can change this from VIEW in combination with the Time Period Chosen (Seconds, Minutes Hours, and Days)
i. LAST shows the last recorded value of the Tag during the time period.
ii. Average shows the average value.
iii. Minimum will show the smallest value.
iv. Maximum will show the largest value.
If seconds are the time period chosen by the user, the Last value is always shown. Seconds is the default period chosen. You entry here will affect the Minutes, Hours and Day time periods.
18. The Display High and Display Low to "zoom in" or "zoom out" of trend data. By default, WebAccess uses the High Span and Low Span of the Tag. DataLog Trend Displays have configurable Display High and Display Low values for the y-axis (and x-axis in X-Y Plots). Trend displays will “remember” changes made to Display High and Low from VIEW and ViewDAQ. The Display High and Low are assigned to the Trend Group, allowing the same tag to have different sets of Display High and Low when assigned to multiple display groups.
19. Click Submit when you are finished.
20. There are two ways to download these changes to the SCADA Node:
20a. Download and Restart the SCADA node from the SCADA Node properties page. If you have never downloaded the SCADA node before, then this is required. This will temporarily stop the SCADA node (if it is running).
OR
20b. Use the Download hyperlink on the Data Log Trend Display Group List Page (figure 6.4 above). This will download changes to the Data Log Trends without stopping the SCADA node.
At least one Data Log Trend Display group must be configured to view Data Log Trends. The New Tag button can be used to add tags (temporarily) to any Data Log Trend Display. If your users will regularly view the same tags in a trend, it is probably best to configure multiple Data Log trend groups for their convenience.