Accessing the dialog
To access the Axes dialog for a specific Trend Control screen object, first access the Object Properties dialog for that screen object and then click Axes.
The dialog in detail
Figure 1.
Axes dialog
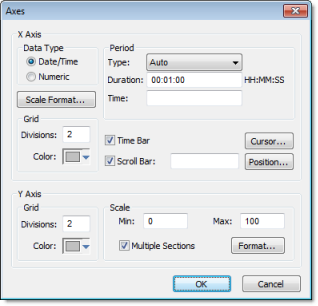
The Axes
dialog contains the following elements:
| Area / Element Name | Description | ||
|---|---|---|---|
| X-axis | Data Type | Date/Time | |
| Numeric | |||
| Scale Format | |||
| Period (when Data Type is Date/Time) | Type |
|
|
| Duration | Defines the Period of data displayed on the object. You can configure a string tag in this field, so you can change the duration dynamically during runtime by changing the value of this tag. The format of the value supported by this property is HH:MM:SS. For example, 36:00:00 (thirty six hours). | ||
| Time |
This field is optional. The value of the tag configured in this
field represents a period of time, rather than a specific date or
time. The meaning of this value depends on the option set for the
Type property.
If the Time field is left blank (or if the tag configured in this field has the value 0), the object displays data up to the current Date/Time. |
||
| Period (when Data Type is Numeric) | Min / Max |
Minimum and maximum values displayed on the X-axis.
The Min and Max properties can hold real numeric values up to six decimal places. If you need more precision than that, then you must configure the Min and Max properties with Real tags and then store the values in those tags. |
|
| Eng. Units | Engineering Unit (e.g., Kg, BTU, psi) that is associated with the X-axis during runtime. | ||
| Grid | Divisions | You can configure the number of divisions (vertical or horizontal lines) drawn on the object for the X and/or Y-axis respectively, as well as the color of these lines. | |
| Color | |||
| Time Bar | When checked, the Time bar is displayed below the X-axis during runtime; otherwise, it is hidden. The time bar is a standard interface that can be used by the operator to change the X-axis scale during runtime. | ||
| Scroll Bar | When checked, the Scroll bar is displayed below the X-axis during runtime; otherwise, it is hidden. The time bar is a standard interface that can be used by the operator to navigate through the X-axis scale during runtime. Optionally, you can configure a tag in the Scroll bar field, which defines the period for the scroll bar. If this field is left empty, the period is equal to the current value for Duration of the X-axis. | ||
| Cursor | The cursor is an optional ruler orthogonal to the X-axis, which can be used during runtime to obtain the value of any pen at a specific point (intersection of the pen with the cursor). When you click this button, the Cursor dialog launches, where you can configure the settings for the optional vertical cursor as follows: | ||
| Positon | Defines the position of the X-axis, as well as its direction and orientation, as follows: | ||
| Y-axis | Grid | Divisions | You can configure the number of divisions (vertical or horizontal lines) drawn on the object for the X and/or Y-axis respectively, as well as the color of these lines. |
| Color | |||
| Scale | Min / Max | Default minimum and maximum values displayed in the Y-axis. Used when more than one pen shares the same scale (Multiple Sections disabled), and/or for the points whose Min and Max fields are not configured (left blank). | |
| Multiple Selections | When checked, the Y scale is divided automatically into one section for each pen; otherwise, all pens share the same Y scale. | ||
| Format | Launches a dialog for configuring the format of the labels displayed by the Y-axis. | ||
Note: The
tags configured in the Period/Range fields are automatically updated
when the user changes the X scale dynamically during runtime, using
the Time bar embedded in the object.
- Data Type: The
X-axis can display either Date/Time values or numeric values,
according to this setting.
Data Type Scale Format Date/Time 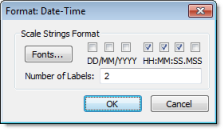
Numeric 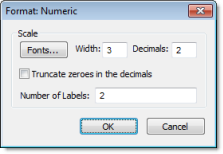 Note: The number of decimal points for the X or Y scale (Decimals) can be configured with a tag. Therefore, this setting can be modified dynamically during runtime.
 - Cursor: The cursor
is an optional ruler orthogonal to the X-axis, which can be used
during runtime to obtain the value of any pen at a specific point
(intersection of the pen with the cursor). When you click this
button, the Cursor dialog launches, where you can configure the
settings for the optional vertical cursor as follows:
Figure 2. Cursor Dialog
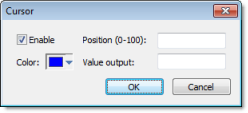
Property Description Enable When checked, the vertical cursor is visible during runtime. Color Color of the line drawn for the cursor. Position (0‑100) You can configure a numeric tag in this field, which is proportional to the position of the cursor on the X-axis, from 0 to 100%. When this value is changed, the position of the cursor is automatically modified. Value Output You can configure a string tag in this field that returns the value of the X-axis in which the cursor is currently positioned. - Position: Defines
the position of the X-axis, as well as its direction and
orientation, as follows:
Figure 3. Position Dialog
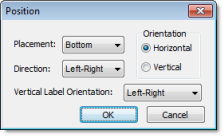
Property Description Placement Side of the trend control on which the X-axis will be placed. Direction Direction of the X-axis. Orientation Orientation of the X-axis. Vertical Label Orientation The orientation of the text labels on the vertical axis, regardless of whether the vertical axis is X or Y.