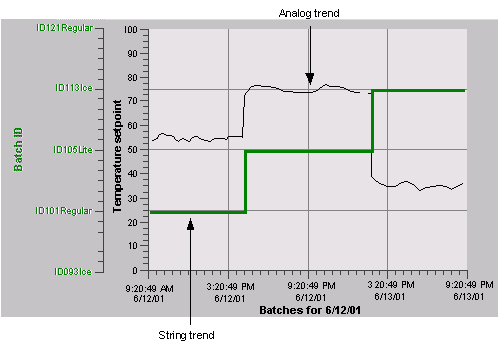
Typically, Time and Event charts trend numeric, analog values. These values vary over the x axis and range between a high and low limit. Often it is helpful to superimpose the trends of digital or string data over analog trends. Trends of digital or string data typically show the state of a data source during production or show an identifying string (such as a batch ID or lot number) for the analog trend. By combining analog trends with digital/string trends, understanding what has transpired is easier and reading the chart becomes more intuitive.
In many manufacturing environments, each run of a batch is identified by a batch ID or lot number. By trending this data against another value, you can quickly determine if your production is operating correctly.
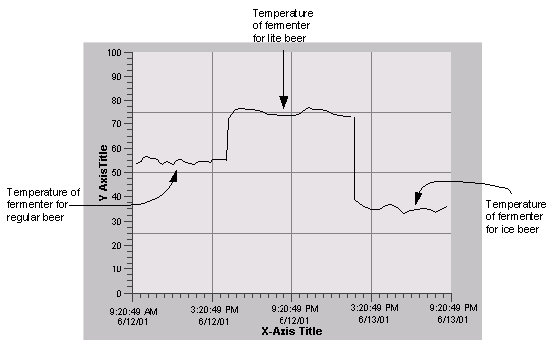
For example, assume you are making three different types of beer: regular beer, lite beer, and ice beer. Each type of beer requires a different temperature setpoint at which the beer ferments. By trending the temperature, you can determine if the setpoint is correct for each batch, as the following figure shows.
However, if you trend the batch ID for each run, the chart becomes much easier to read, as the following figure shows.
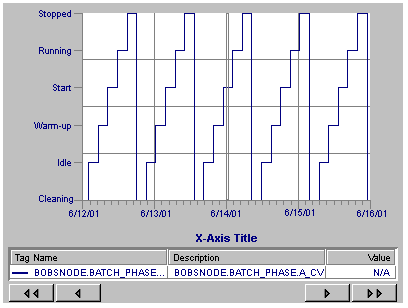
The fermenter has the following discrete states:
Idle – when no beer is being made.
Warm-up – when the fermenter first starts to ensure the thermocouple has power and is sensing temperature correctly.
Start – when unfermented beer (the wort) is transferred into the fermenter.
Running – when the wort is fermenting into beer.
Stopped – when beer has fermented and is transferred to barrels for aging.
Cleaning – when the fermenter is being cleaned.
Using Proficy Portal, you can trend these states by treating each state as a string, as the following figure shows.
You can trend data source values as strings by selecting a data source containing string data. The chart automatically recognizes the data type of the data source and selects the String Data check box on the Pen tab. When the chart selects this check box, the High Limit and Low Limit fields are disabled because string data has no EGU limits. Instead, when Proficy Portal retrieves the data from the server, it determines the number of unique values the data source has and displays them on the y axis.
When trending strings, you have the option of sorting them in ascending or descending order. You can also display values in an unsorted manner. Unsorted strings appear in the chart in the order they are retrieved from the server.