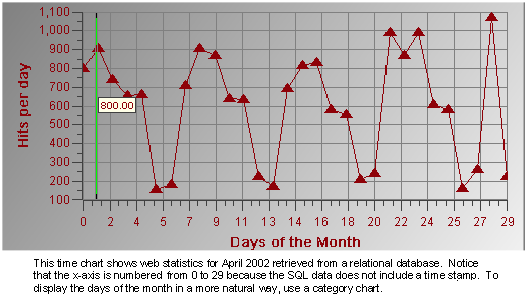
Even though SQL data is typically not time-based, you can trend data from a relational database in a Time chart. When you select such a data source, the time chart examines the data it receives. If the data includes a time stamp in the same column as the data, the chart assumes the data is time-based. If a column exists with a DateTime data type, then that column becomes the x axis. However, if no time stamp is provided in the same column as the data, and no DateTime column is found, the x axis displays a series of numbers from 0 to n, where n is the number of values received from the relational database.

You can display a line graph of SQL data in a category chart. The benefit of using a category chart to display this data is the ability to switch to a Bar or Pie chart and the ability to transpose the row and column data. For more information about using a category chart, refer to Category Charts.
An alternate method of trending SQL data is to create an SQL statement with start and end time parameters. Load the SQL statement into a Time chart, and then use a linked Time Component object to manipulate the start and end time of the data. For more information on creating SQL statements, see To create a new statement. For more information on linking a Time Component object to another object, see Time Parameters.