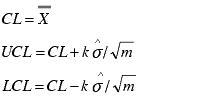
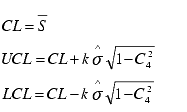
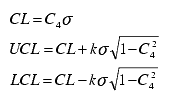
XBar-S chart control limits are calculated as follows:
|
|
Control Limits calculated
from |
Control Limits calculated
from |
|
XBar chart control limits |

|

|
|
Sigma chart control limits |

|

|
NOTE: If subgroup size is variable, m is replaced with mi for ith subgroup limits. When subgroup size is variable, the control limit values will not be the same; therefore, the chart may display `city skyline' type control lines.
Subgroup Mean (upper chart)
Subgroup Sigma (lower chart)
Lower Control Limit (LCL) (optional)
Upper Control Limit (UCL) (optional)
Warning lines (optional)
Lower Control Limit (LCL)
Upper Control Limit (UCL)
Center Line (CL)