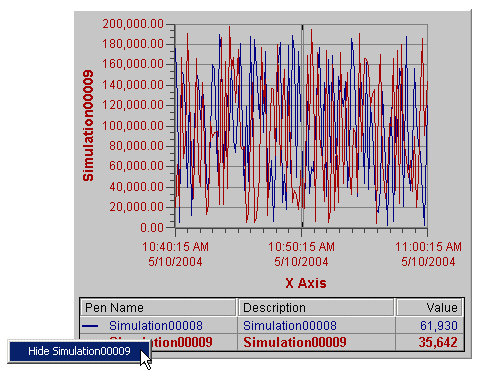
You can hide or show pens in a Time, XY, or Event chart during run-time. To hide a pen, right-click the pen in the chart's legend and select Hide [Pen]. The following figure shows a pen being hidden.

When a pen is hidden it is no longer displayed on the chart and it appears grayed out in the legend.
To show a pen after it has been hidden, right-click the grayed out pen in the legend and select Show [Pen].