During run-time, you can click on any pen in the legend of a Time or Event chart to display the pen's x and y axis configuration options on the chart. Similarly, in XY and Correlation charts, you can click any pen in the legend to display the pen's y axis configuration options on the chart.
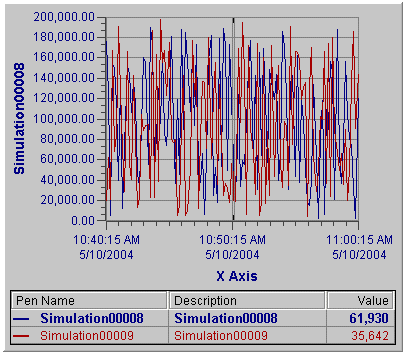
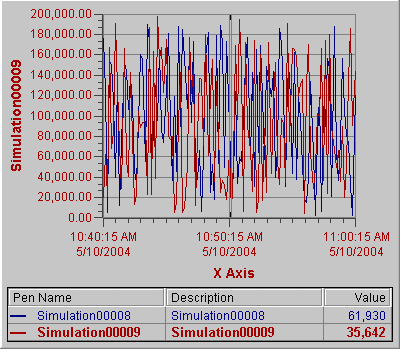
The following figures show an example of the same Time chart, where the pen configurations are switched. In the first chart, Simulation00008 is selected; in the second chart, Simulation00009 is selected. Simulation00009 has different settings for high and low limits, has a different start time, and places grid lines at minor ticks instead of major ticks.
Pen Simulation00008 is selected in the following:

Pen Simulation00009 is selected in the following:
