Draw a graphic display with animation using the pre-animated widgets.
1.
Click the Widget icon ![]() from the upper toolbar.
from the upper toolbar.
Hint - If you pause the pointer over the icon
a tooltip opens describing the button ![]() .
.
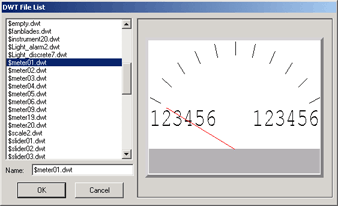
2. Use the scroll bar to $meter01
3. Select $meter01 from the Draw Widget Dialog Box.

Draw Widget Dialog Box
4.
Select OK. ![]()
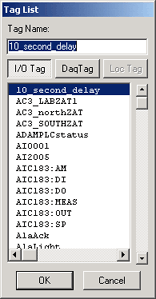
5. The Tag List appears.


I/O Tag list may be empty in a new system. Usually, you would use the IO Tag list for animation, but in case you are on a new system without IO Tags, we will use a pre-built System Tag for this example
6.
Click the DaqTag
button ![]() to see some system tags.
to see some system tags.
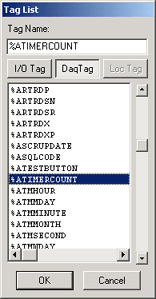
7. Scroll down to %ATIMERCOUNT.
8.
Click on %ATIMERCOUNT and
select OK ![]() .
.
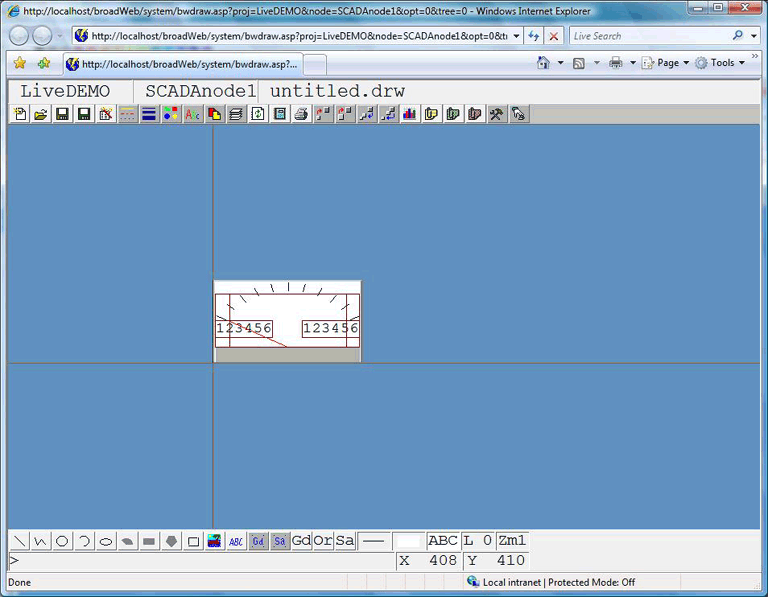
9. The Widget appears in Outline form with a cursor. Position the Widget where you want it drawn.

10. Click the left mouse button to draw the widget.

Congratulations! You have just drawn and animated a meter that will indicate the value of your tag. The needle will move as the value changes. The High Scale and Low Scale of the Tag will be displayed.
You can continue to draw some text, animate Text and draw some pushbuttons.
Or you can save the graphic and download your graphic to the SCADA node in order to VIEW it now.