The Process Analyst control allows Operators to
view trend and/or alarm tag data (both real-time and historical)
for comparison and analysis during run time through their existing
CitectSCADA server
architecture.
If you have access to an installation of
CitectHistorian, you can also incorporate attributes published on a
Historian Web Server.
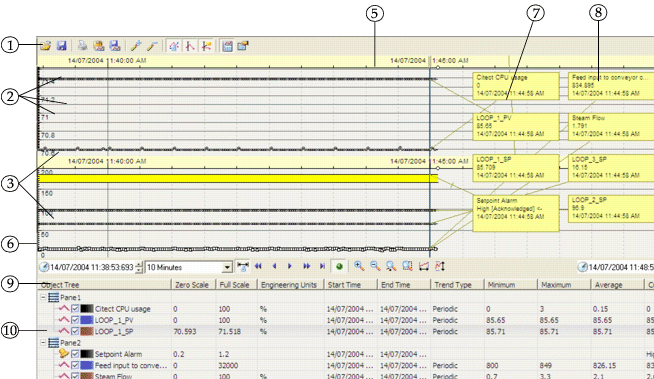
A typical Process Analyst view might look like the
one shown here. Your Process Analyst views will probably look
different to this example.
The Process Analyst control interface typically
consists of the following components:
Main toolbar: Contains commands
for performing general operations in the Process Analyst, such as
opening views, printing reports, and so on. You can configure this toolbar to contain
different items.
Pens: A pen draws
sample values against time. The Process Analyst supports three
types of pen: analog, digital, and alarm.
Analog and digital pens are associated with
trend tags, as well as time-series items and attributes from a
Historian connection. Alarm pens are associated with alarm tags and
Historian alarm attributes.
Panes: Panes
are used to group pens visually in the Process Analyst and are
stacked vertically on the Process Analyst display. Every pen
belongs to a single pane. You can configure chart panes.
Chart background
(not shown): The panes are drawn over the chart background.
Depending on the layout of the pens, the background may be
partially visible. You can configure the chart background.
Date/time axis: Located at
the top of a pane, the date/time (horizontal) axis displays the
date or time (or both) of the data for the primary selected pen
within a pane. You can configure the axis.
Vertical axis: Analog pens have a
vertical axis on the left-hand side of the pane to indicate data
values. You can configure this
axis.
Cursor: A cursor allows an Operator to
determine value at a given point in time by dragging the cursor
line to the point necessary. You can configure the cursor.
Cursor labels: Display the value
where the cursor intersects the trend value line.
Navigation toolbar:
Contains commands to allow an Operator to travel forward or
backward through trends, as well as other navigation-related tasks.
You can configure this
toolbar to contain different items.
Object View: When displayed, the
Object View appears under the navigation toolbar and displays
information about your Process Analyst pens, such as name, color,
scale, and so on. You can configure the Object
View.