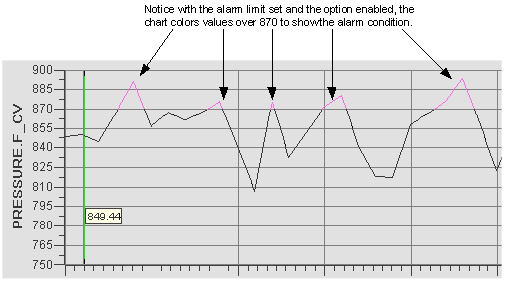
Alarm limits can be set on real time or historical process data in Time, Event, and XY charts. An alarm limit is a value beyond which you do not want the process value to exceed. For example, if you are manufacturing dry ice, you need to control the pressure and the temperature of the process to first liquify the carbon dioxide and then to freeze it. If the pressure is too low in the first phase, the gas does not liquify. Likewise, if the heat is too high, the gas does not freeze in the second phase of the process.
These limits, 870 pounds per square inch and -109.3 Fahrenheit, are the alarm limits because if the pressure or the temperature exceed these values, an alarm (an error condition) occurs.
You can display when data in your trends exceeds specific limits by specifying the following information:
The high alarm limit
The low alarm limit
The color to display alarm values with (the alarm color)
You also need to select the Enable Alarm check box to show alarm data in the chart. For example, the following chart shows the alarms for a trend of pressure during the manufacture of dry ice.
