The VisualSPC Data Source is used to connect with ShopFloor SPC databases.
A VisualSPC data source consists of the following:
Parts – Parts from the ShopFloor SPC source database. These consist of characteristics that are of the types Variable, Attribute, and Attribute:Defects. The types of objects used with the three types of characteristics vary. For Variable characteristics, only Variable SPC chart types can be used. For Attribute characteristics, only Attribute SPC chart types can be used.
Characteristics that are of type Attribute:Defects appear as <CharacteristicName>:Defects; for example, Appearance:Defects. Attribute characteristics return the total defects and sample size, and therefore can be used with the following types of Attribute SPC charts: P, Np, C, and U charts. The characteristic type Attribute:Defect returns the defect name and defect count, and is designed for use with the Pareto chart only. For more information on SPC charts, refer to SPC Chart Types.
NOTE: In a Parts characteristics grid, a Sample value -99,999 indicates MISSING data.
Data Tables – tables that provide a means of building displays with parts data. The tables are equipped with default values for input parameters, and allow you to easily sort and filter data, as well as link objects (i.e., grids, SPC charts, and list boxes). There are four data tables available for use: Summary Statistics, Stations, Parts, and Characteristics. The following figure shows these tables as they appear in the Data Source Browser:

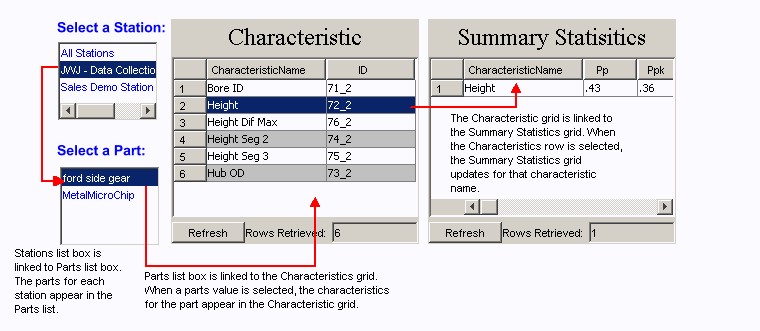
The following sample display illustrates a simplistic example of how these tables can be used. The display consists of two list boxes and two grids. The Stations table has been used to create the Select a Station list box, and the Parts table has been used to create the Select a Part list box. The Characteristic grid has been created from the Characteristics table, and likewise the Summary Statistics grid has been created from the Summary Statistics table.

For information on linking objects, see Parameter Connections.
The previous example display uses list boxes and grids; however, typically SPC charts would also be included for analysis purposes. For an example that uses SPC charts, see the Proficy Portal sample system/Quality folder/Summary_Statistics display.
When linking objects to pass parameters from one object to another, it is important to be familiar with the default input parameters and columns that are built into each table. The following table shows the defaults for each table.
|
Data Table |
Columns |
Input Parameters |
|
Stations |
Station |
N/A |
|
Parts |
Part |
Station or NONE |
|
Characteristics |
Characteristics ID or PartCharID |
[Station and/or Part] or NONE |
|
Summary Statistics |
ID Station Name |
Part Name Filter Char Name Filter Station Filter |
Filtering
When Data Tables are used, you can also use filtering to retrieve only the relevant data. For more information, see Configure for Parts.
To filter the data table parameters, use expressions. The table below provides a few examples of the types of valid expressions. The expressions can be combined if required.
NOTE: When using an Oracle database source, only * and _ can be used for filtering (refer to the first 2 rows of the following table).
|
Use these characters... |
To return... |
|
* |
Any characters. |
|
_ |
Single character placeholders, for example, B_g* returns data where the first and third characters are `B' and `g' respectively. |
|
[a-k]* |
All data where the first character is between or includes a and k. |
|
[a-k|1-3]* |
All data where the first character is between or includes a and k OR 1 through 3. |
|
[b|e]* |
All data that starts with a `b' or `e'. The | symbol is used for OR. |