You can use the Output window to view debugging messages generated during project runtime. The window displays OPC, DDE, and TCP/IP transactions, module activation, trace tags, and so on.
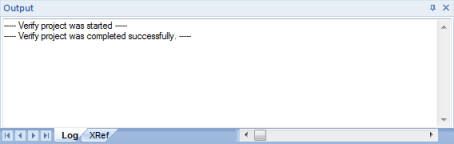
- XRef tab: Use the
Cross Reference tool to get a tag, and to
find every place in the project where the tag is being used.
Results appear on this tab, providing path and filename, column,
row in the spreadsheet. So, if something changes in the tag, and
produces unexpected or unsuccessful results, you can locate all
instances of the tag for debugging purposes.
Note: The XRef tab does not work for functions, only tags, but it does allow you to look for array indices.
- Hide Docked Window
button (
 ): Click to open or
close the window.
): Click to open or
close the window.
Alternatively, to hide the window, you can deselect (uncheck) the Output Window option on the View tab of the ribbon.
- Contract/Expand
button (
 ): Click to
contract and expand the Output window.
): Click to
contract and expand the Output window. - Scroll Bars: Click and drag to view areas of the Output window that are obscured from view because of the window size or the length of your data.
The Output window is dockable, which means you can move it to another location in the development environment. Click on the title bar and drag the window to a new location. Release the mouse button to attach or dock the window to its new location.
Configuring the Log to Show Additional Information
By default, the log shows only debugging and error messages — that is, messages indicating that your project is not running properly. If the log showed all messages generated by IWS, it would quickly overflow with information, making it unusable.
- Right-click anywhere in the Output window, and then click Settings on the shortcut menu. The Log Settings dialog is displayed.
- In the Log
Options tab of the dialog, select the specific types of
messages that you want the log to show.
Figure 2. Log Settings — Options Tab
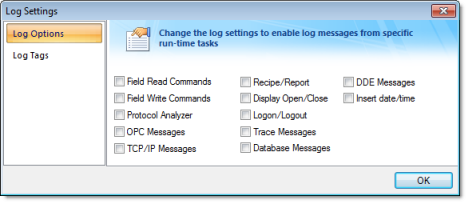
Option Description Field Read Commands and Field Write Commands Show any read and/or write commands that are sent to connected devices. Protocol Analyzer Show messages generated by configured device drivers. OPC Messages Show messages generated by OPC communications. TCP/IP Messages Show messages generated by TCP/IP communications. Recipe/Report Show messages generated by the Recipe and Report tasks. Display Open/Close Display a message whenever a screen is opened or closed. Logon/Logout Display a message whenever a user logs on or logs out. (For more information, see Security.) Trace Messages Show messages generated by the Trace() function. This function is used to generate customized messages from within your project. Database Messages Show messages generated by the ODBC and ADO.NET database interfaces. DDE Messages Show messages generated by DDE communications. Insert date/time Timestamp each message. - In the Log
Tags tab of the dialog, click Add to browse for project tags.
Figure 3. Log Settings — Tags Tab
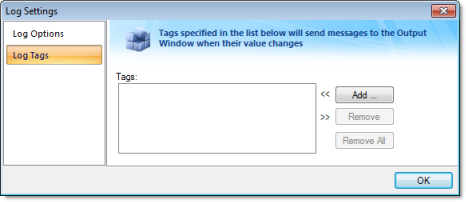
The Output window will display a message whenever the value of a selected tag changes.
- Click OK to save your settings and close the Log Settings dialog.