Click one of the following for information on the Historian Edition sample displays:
NOTE: If you are having difficulty with the sample displays (e.g., data is not being retrieved), see Using the Sample System.
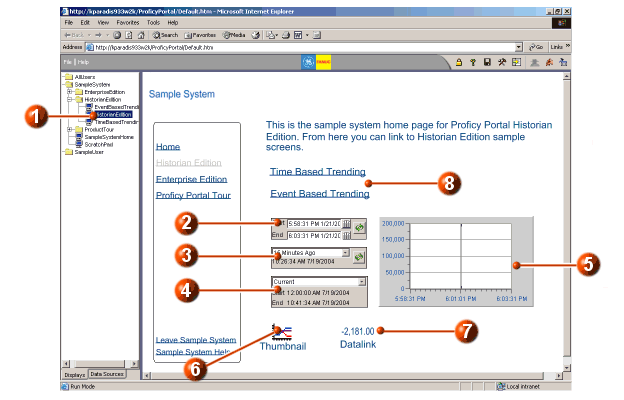
The HistorianEdition sample display provides links to two other Historian displays, links to Enterprise Edition, and the Proficy Portal Tour, as well some featured components available with Proficy Portal's Historian edition. Refer to the following illustration and legend for detailed information.

|
|
Click here to access the HistorianEdition sample display. |
|
|
Click here to update the start or end times. When you click the Refresh button, the Time chart (see #5) updates according to the time span you specified. This control is a Time Component, configured to allow you to enter absolute start and end times. More The Time Component is sometimes referred to as Quick Time, because it uses the same controls as Quick Time on other objects and on the run-time toolbar. |
|
|
Click here to update the time value. When
you click the Refresh button |
|
|
Click here to update the time value. When you click the Refresh button, the Time chart updates according to the time span defined by the value. This control is a Time Component, configured to allow you to enter a range value (for example, if you select Day Shift, the time span on the chart is updated to the times that are defined as Day Shift in the Named Times Editor). More |
|
|
The Time chart shows data for a specific time span. You can update the time span using any of the three Time Component objects (see #2, #3, and #4). The three Time Component objects pass time parameters to the Time chart. More |
|
|
Click the Thumbnail object to open the popup Time chart. The Thumbnail can be used to place a chart or grid on your display where space may be limited. More |
|
|
Right-click the Datalink and choose either Time chart or Historian grid. The Datalink shows the current value of a tag, and can be configured to pop up a chart or grid to show the values of the tag in a different format. More |
|
|
Links to other Historian Edition sample displays. See TimeBasedTrending and EventBasedTrending for more information on these displays. |
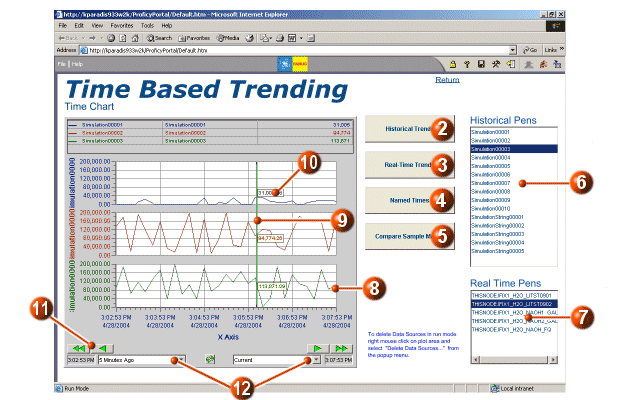
The Time Based Trending display uses historical and real-time data. The main purpose of this display is to allow for trending of historical or real-time data over a time period that you specify. Refer to the following illustrations and legend for detailed information.


|
|
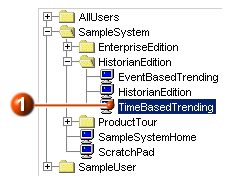
Click here to access the TimeBasedTrending sample display.
If you cannot see the entire display, click the |
|
|
Click the Historical Trends button. Historical pens are loaded into the chart. Each of the four buttons: Historical Trends, Real-Time Trends, Named Times, and Compare Sample Modes is a button object configured with a Load Pen Group command. More |
|
|
Click the Real Time Trends button. Real-time pens are loaded into the chart. |
|
|
Click the Named Times button. One pen is
loaded into the chart. The data is string data. Use the Quick Time
controls (see #12) with the string pen to illustrate the trending
of string data. Select `Start of Day Shift' from the Quick Time
drop-down list on the left and `End of Day Shift' from the Quick
Time drop-down list of the right. Click the |
|
|
Click the Compare Sample Modes button. One tag is added to the chart in four different sample (retrieval) modes. More |
|
|
Click and drag a pen in the Historical Pens list onto the chart. The Edit Source dialog box appears. You can select different options on the dialog box, or simply click OK. The pen is added to the Time chart. The Historical Pens list is a manually entered list (that is, it is not directly populated by a data source). More |
|
|
Click and drag a pen in the Real Time Pens list onto the chart. The Edit Source dialog box appears. You can select different options on the dialog box, or simply click OK. The pen is added to the Time chart. The Real Time Pens list is a manually entered list (that is, it is not directly populated by a data source). More |
|
|
The Time chart is configured to stack the pens that are added (that is, each pen has its own y-axis). Right-click and choose Stack Y-Axes to toggle between stacking pens/unstacking pens. More |
|
|
Click and drag (left to right) the Time cursor on the chart. As you move the time cursor, you will see Tool Tips with specific values. More |
|
|
Click on one of the Tool Tips to add an annotation (for historical pens only). More |
|
|
Click the Scroll buttons to advance the time span of data retrieval forward or backward. The scroll buttons are configured on the Time chart Configuration dialog box. More |
|
|
Select time values from the drop-down lists. This is a Quick Time control that is configured on the Time chart Configuration dialog box. More |
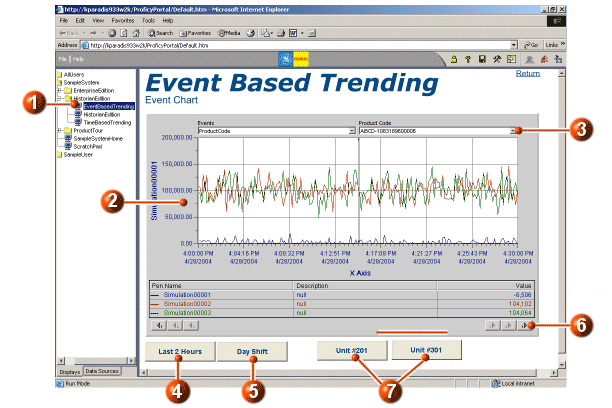
The EventBasedTrending display uses historical data, and captures the basic methods of event trending. Refer to the following illustration and legend for detailed information.

|
|
Click here to access the EventBasedTrending sample display in the System Tree. |
|
|
The Event chart runs with one event group (ProductCode event group). Trend lines are shown for the three pens loaded with the event group. More |
|
|
Select a new product code from the Product Code drop-down list. The start time of the chart changes to accommodate the time span defined for that particular batch. More |
|
|
Click the Last 2 Hours button. The Event chart is loaded with an event group that retrieves the last two hours of values for three pens, and plots the trend line for each pen. The button is configured with the Load Event Group command. More |
|
|
Click the Day Shift button. The chart is loaded with a different event group that retrieves eight hours of values for three pens, and plots the trend line for each pen. The button is configured with the Load Event Group command. More |
|
|
Click the Next button to load the next product code (this is the same as selecting the next product code from the drop-down list). The start time of the chart changes to accommodate the time span defined for that particular batch. More |
|
|
Click Unit #201 or Unit #301 to load a different set of pens into the chart. These buttons are configured with the Load Pen Groups command. More |